## for reading & writing data
library(here)
library(readr)
## for manipulating data
library(dplyr)
library(tidyr)
library(broom)
library(ggpubr)
## for plotting
library(ggplot2)
library(patchwork)
library(hrbrthemes)
library(tidyverse)Introduction
This is an example post of the work I did for Assignment 5 for FISH 549 where I generated an exploratory and expository plot of a data set provided by the class.
Requirements
We will be exploring the data and creating figures using ggplot2. Below are the packages I need to parse through the data and create plots.
Data
The data is already in a csv file format so all we need to do is read it in.
Step 1: Setting the working directory
## data directory
data_dir <- here("posts", "post-with-code", "data")
Step 2: Reading in the data
The data is already in a “tidy” format, meaning all the variables I need are already in columns.
## reading in the data
df <- read.csv(here(data_dir, "siscowet.csv"))

# renaming locID column to Location so that it can display this as my legend title down the line
df <- df %>% rename(Location = locID)
Step 3: Creating an exploratory figure
I want to simply look at the trend of fish weight against fish length.
## exploratory plotting
 ggplot(data = df, aes(x = len, y = wgt)) +
  xlab("Total Length (mm)") +
  ylab("Weight (g)") +
  geom_point()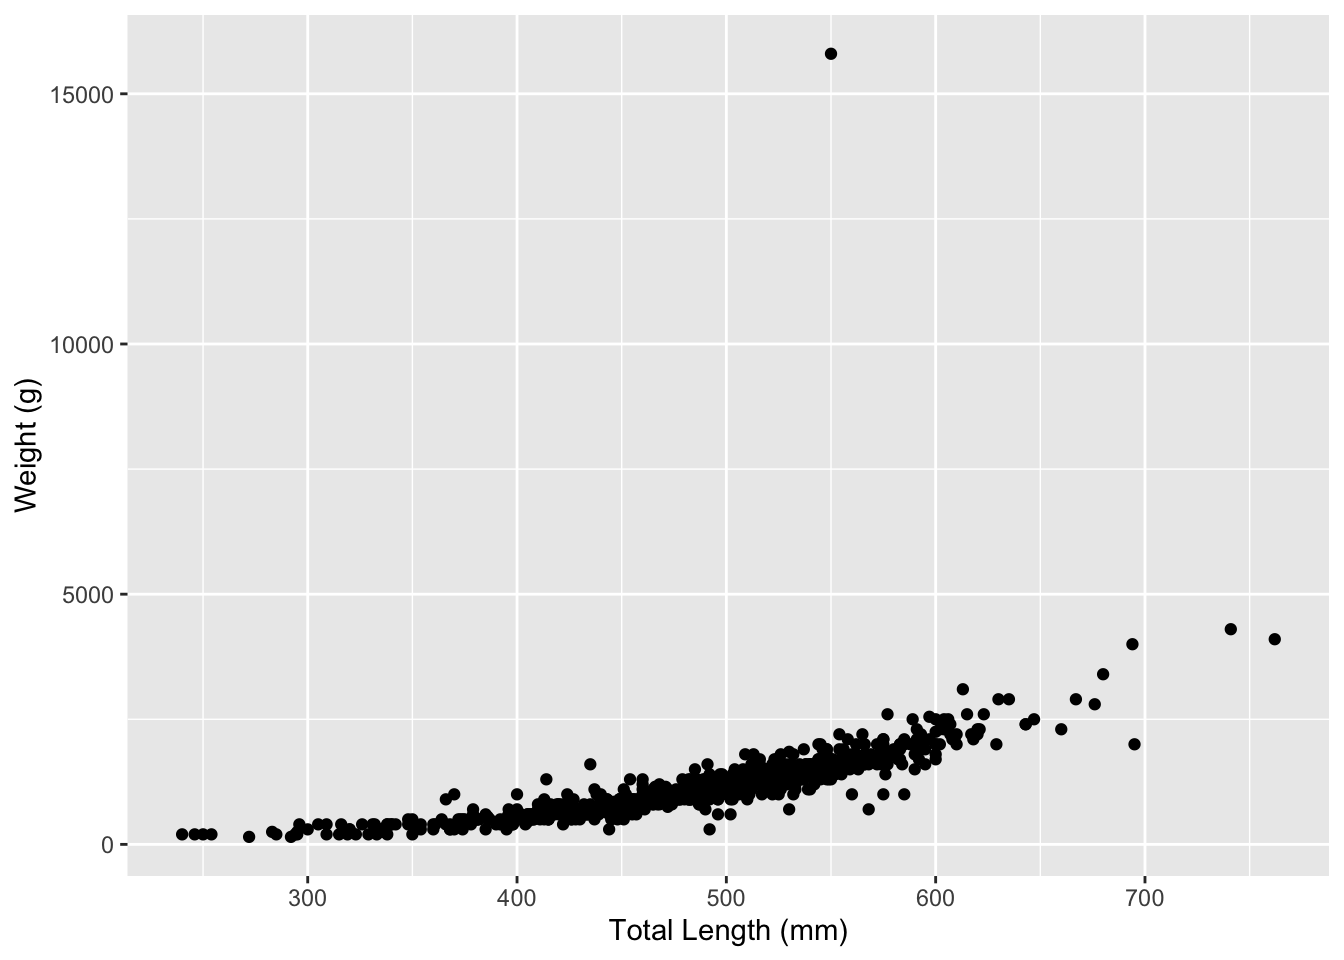
Step 4: Creating my expository figure
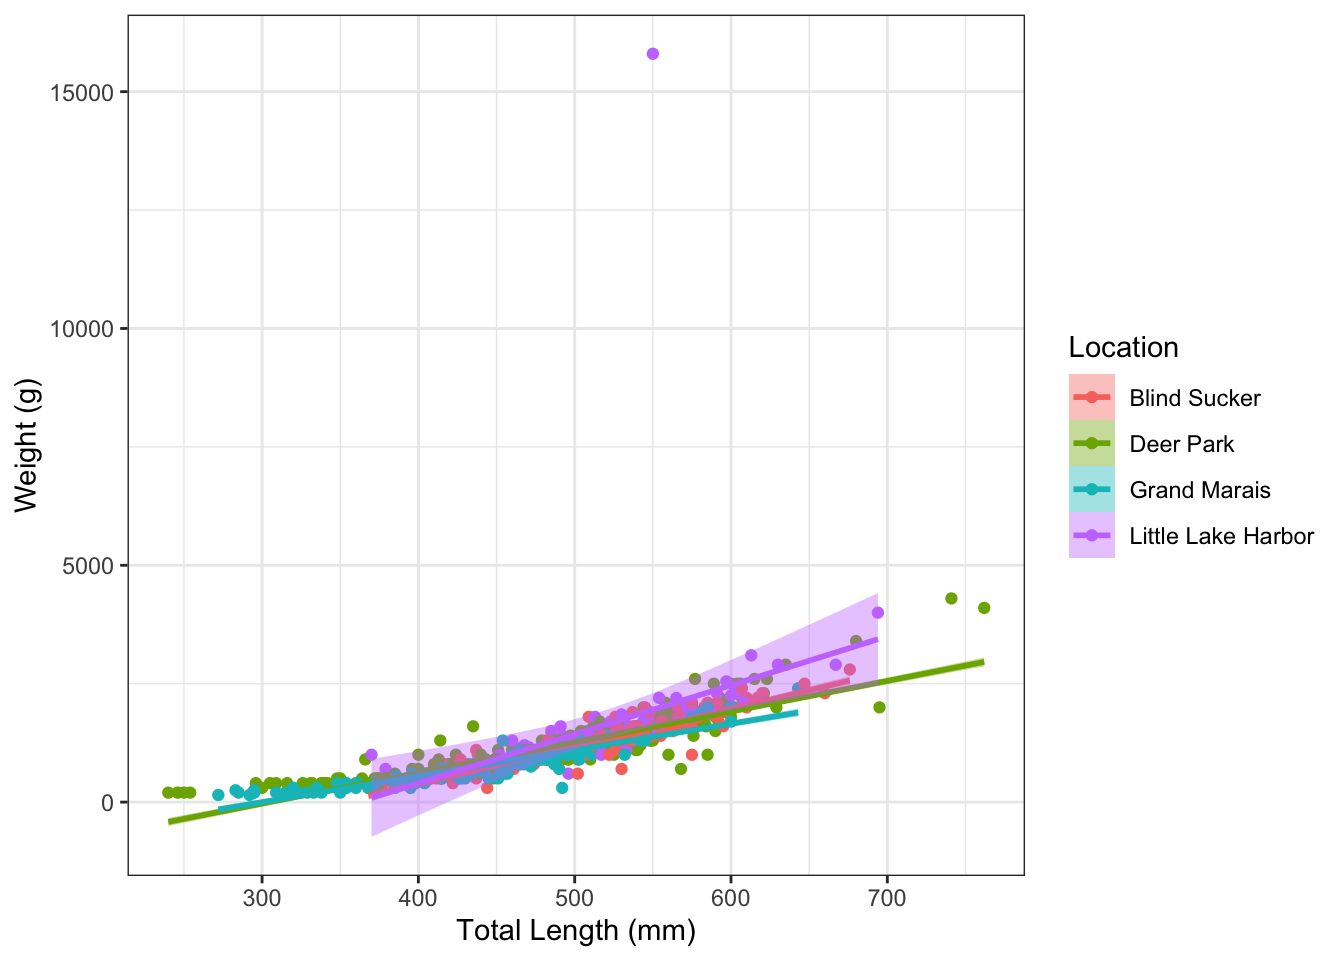
I am interested in seeing the relationship of fish weights and lengths by the different catch locations.
Below I am plotting the length and weight data and color coding the points by the four locations. I also have overlapped a linear regression over my data per location with a 95% confidence interval.
## plotting by locations with the addition of a linear regression line
  ggplot(data = df, aes(x = len, y = wgt, color = Location)) +
  theme_bw() +
  labs(x = "Total Length (mm)", y = "Weight (g)") +
  geom_point() +
  geom_smooth(method=lm, se=TRUE, fullrange=FALSE, level=0.95, aes(fill =Location))