Tunicate culture media (TCM) forulations
Formulated two versions of tunicate culture media (TCM) to evaluate whether it would be better to use a higher dose of antibiotics relative to what is described in
Version 1 TCM This version of TCM follows the instructions in the linked notebook post. Contains the following ratios of solution:
- 63.5% L-15 media
- 30.2% concentrated filtered seawater (FSW)
- 3.3% fetal bovine serum (FBS)
- 1.4% HEPES (20 mMol/L stock)
- 1.4% Penicillin-Streptomycin (100x stock)
- 0.1% Amphotericin B (250 ug/mL stock)
Version 2 TCM
This version of TCM follows the instructions of it’s linked post with the following ratios of solutions:
- 63.8% L-15 media
- 30.5% concentrated filtered seawater (FSW)
- 3.5% fetal bovine serum (FBS)
- 1.4% HEPES (20 mMol/L stock)
- 0.7% Penicillin-Streptomycin (100x stock)
- 0.07% Amphotericin B (250 ug/mL stock)
Colony information
I dissected buds from two colonies collected on 4/20/23.
| ID | sampling_location | stage_dissection | dissection_date | num_buds_extracted |
|---|---|---|---|---|
| DM20230420_01 | De Moines Marina (DM) | A1 | 04-21-2023 | 60 |
| DM20230420_02 | De Moines Marina (DM) | A2 | 04-21-2023 | 30 |
Overview of dissection workflow
The overall protocol followed can be viewed in the this notebook post.
Most notably:
- Colonies were kept in ASW-G (0.05% gentamicin) for 21 hours prior to dissection.
- ASW-PSA the solution was reduced to 0.1% Amp B & 1% Pen-Strep as described in that notebook post.
- Colonies were not tied to glass slide or substrate during the dissection process but were instead free floating in the ASW-PSA dissection solution.
Schematics
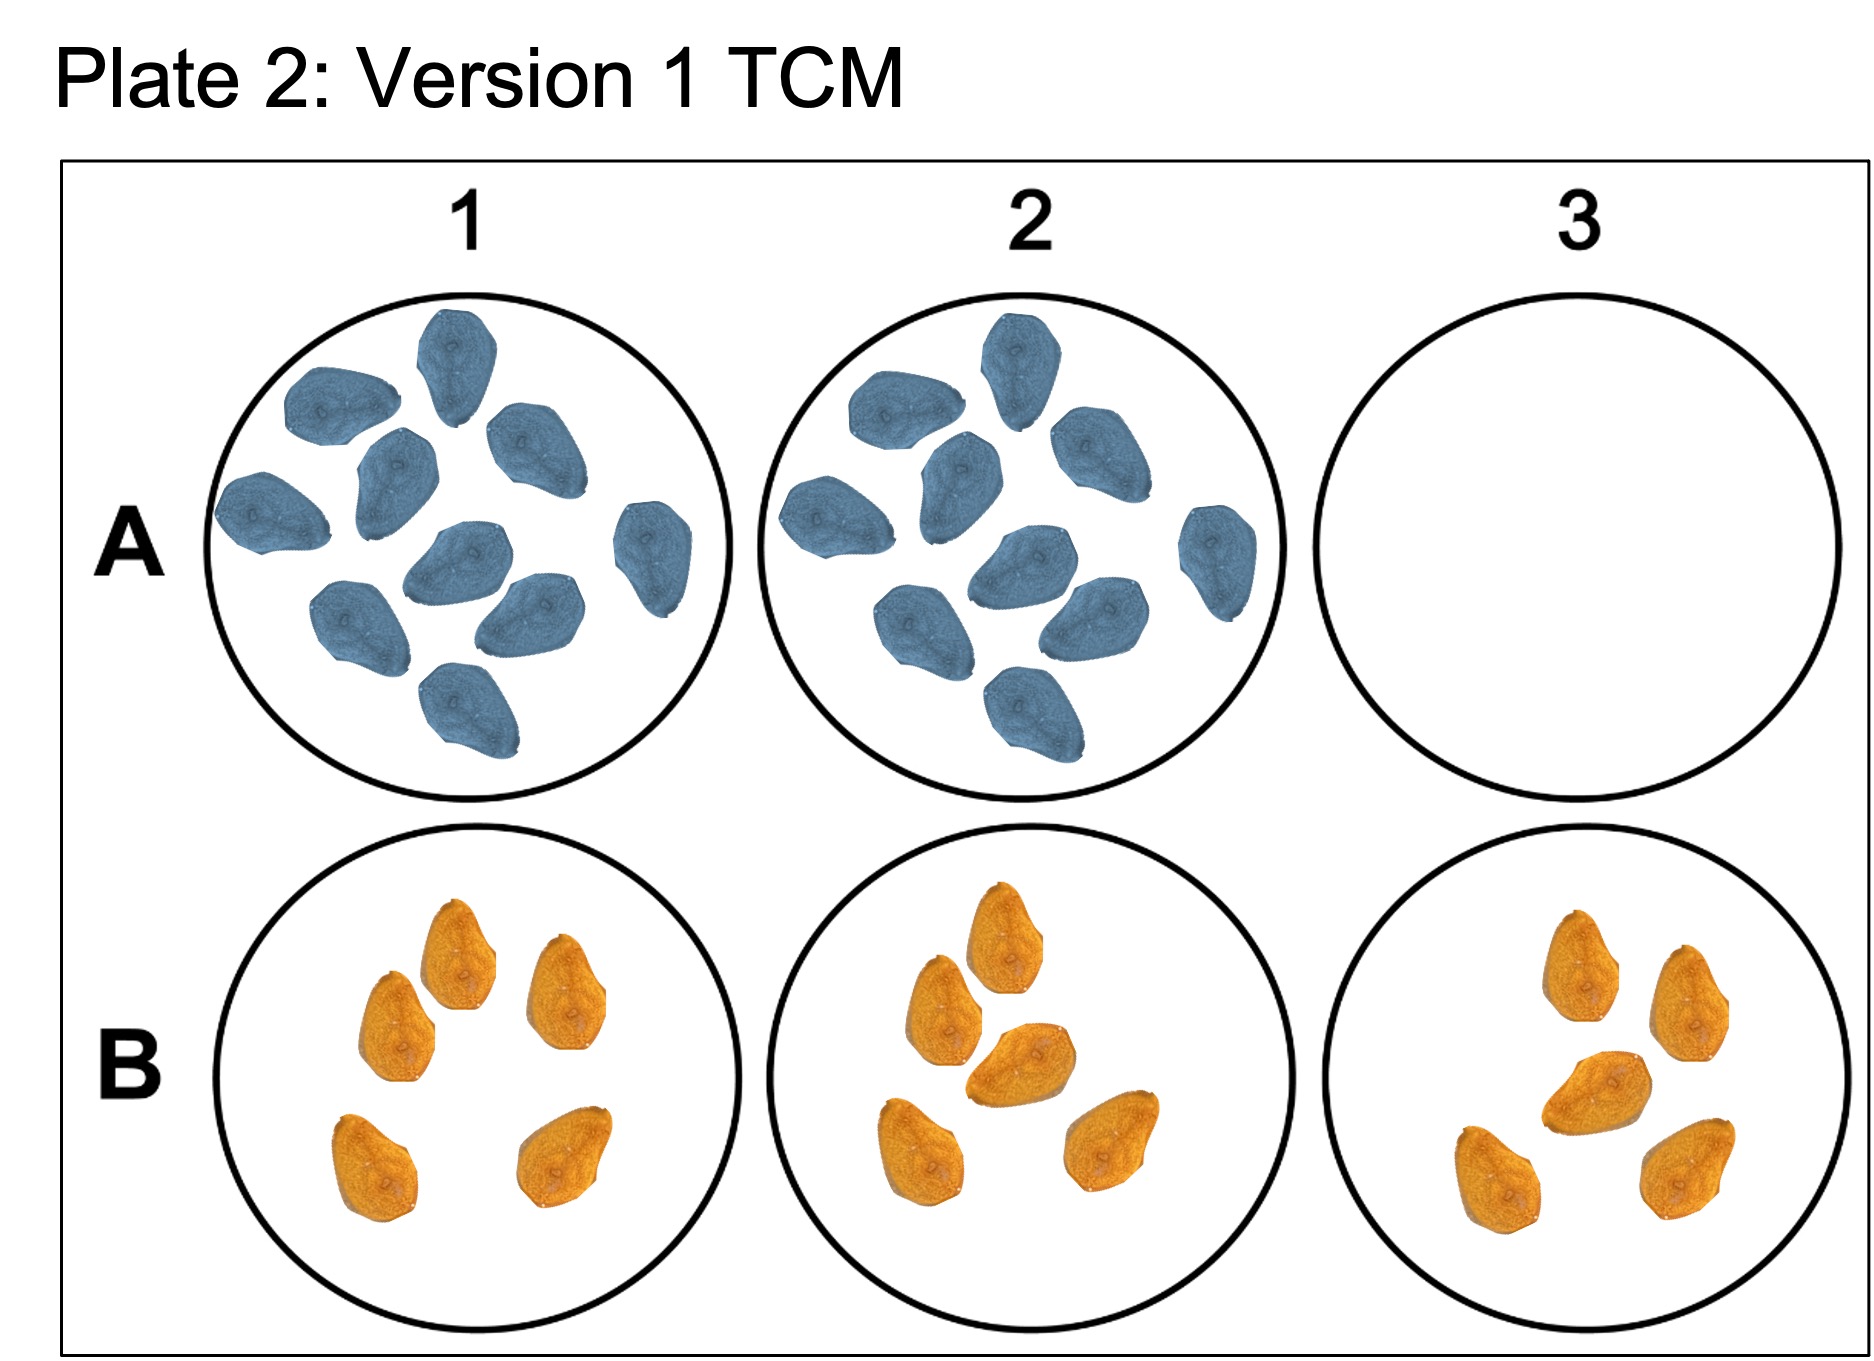
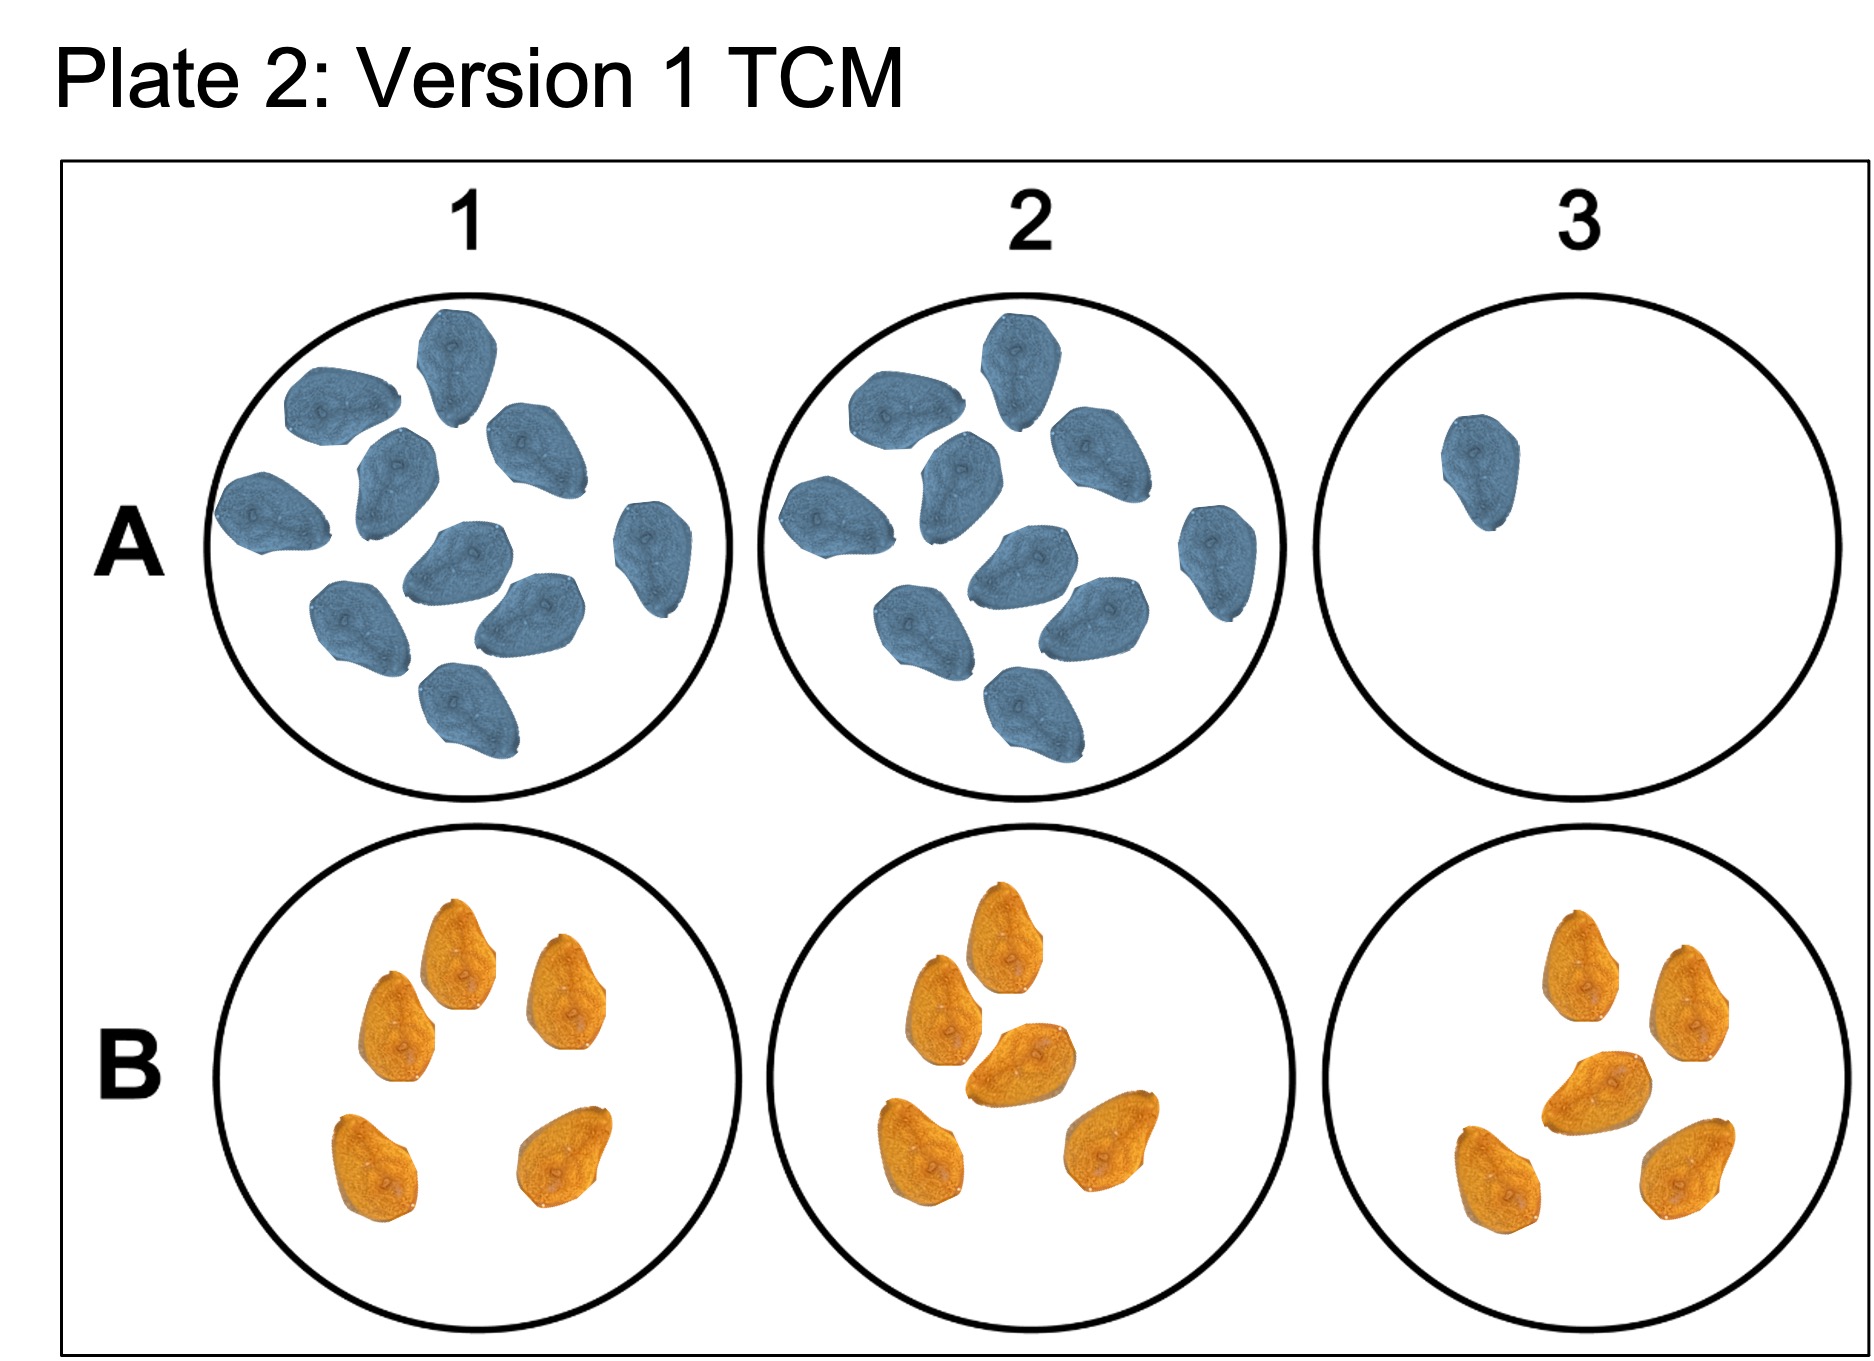
Here the blue color coded buds in wells 1-3 of both plate 1 and 2 are from colony DM20230420_01, whereas the orange color coded buds are from colony DM20230420_02. Plate 1 contains the “lower” dosage of antibiotics while Plate 2 contains the “higher” dosage. Furthermore, for colony DM20230420_01, wells were seeded with twice as much tissue to see if tissue density had an effect on the growth rate of epithelial cells.
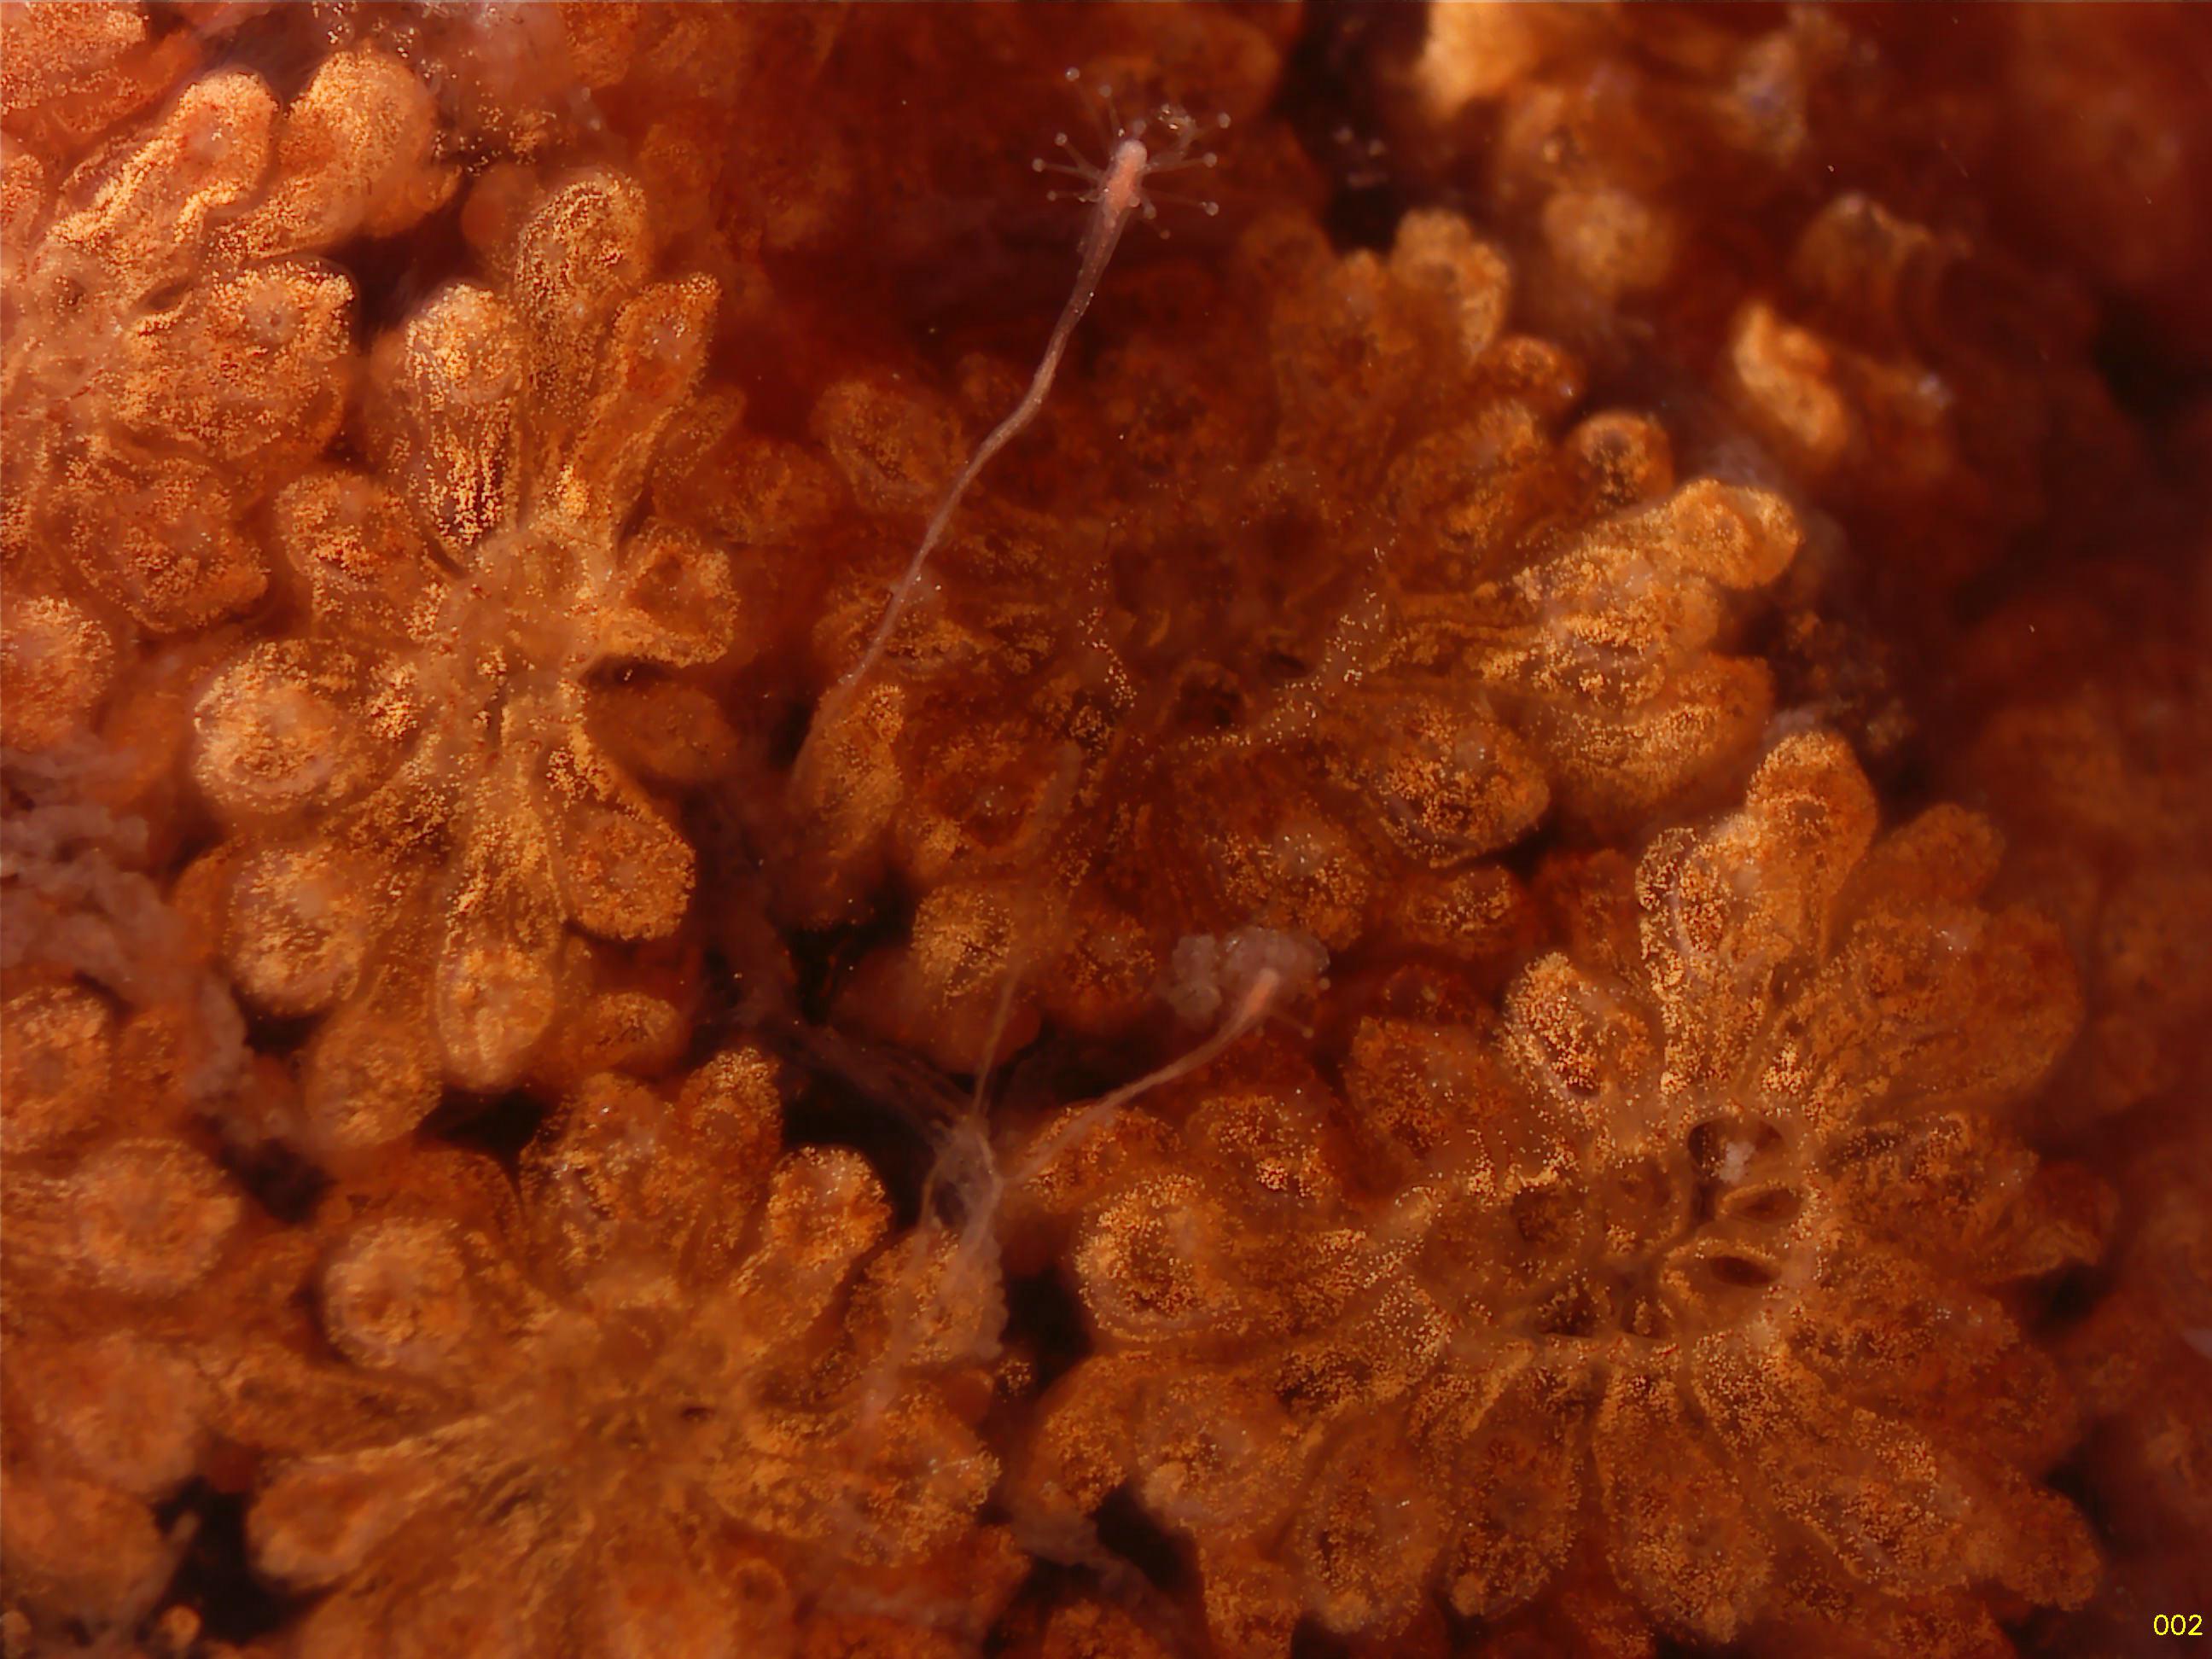
Colony DM20230420_01 just prior to dissection
Here we see that the colony is in stage A2. For the purposes of following the protocol, we are disregarding the ideal stage.
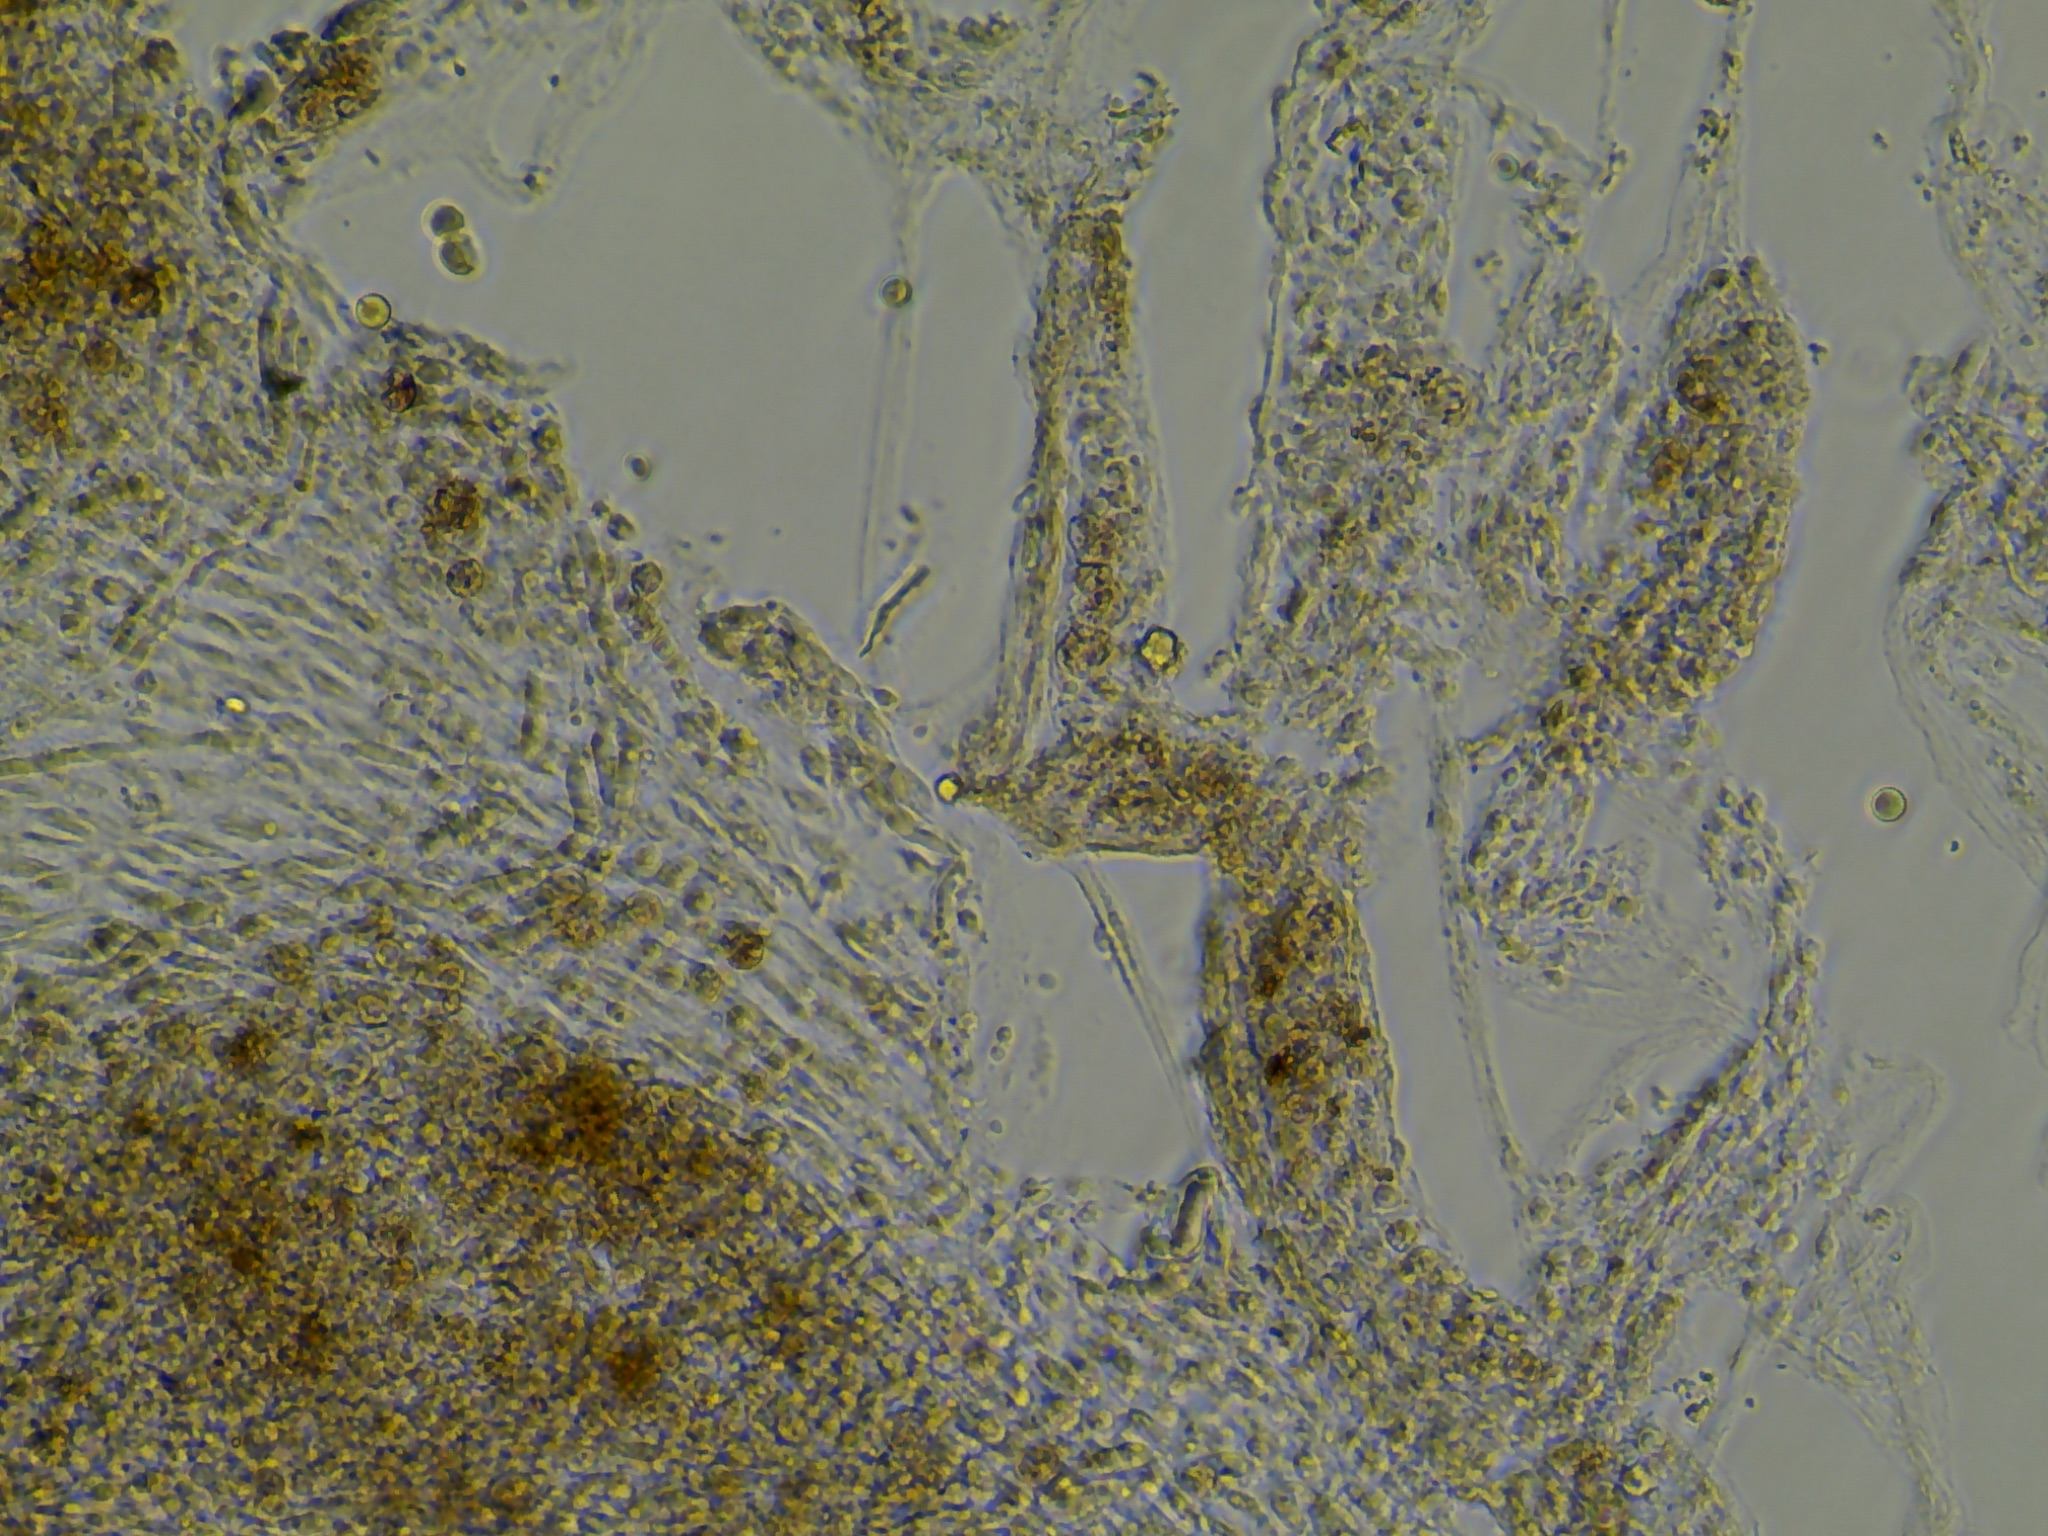
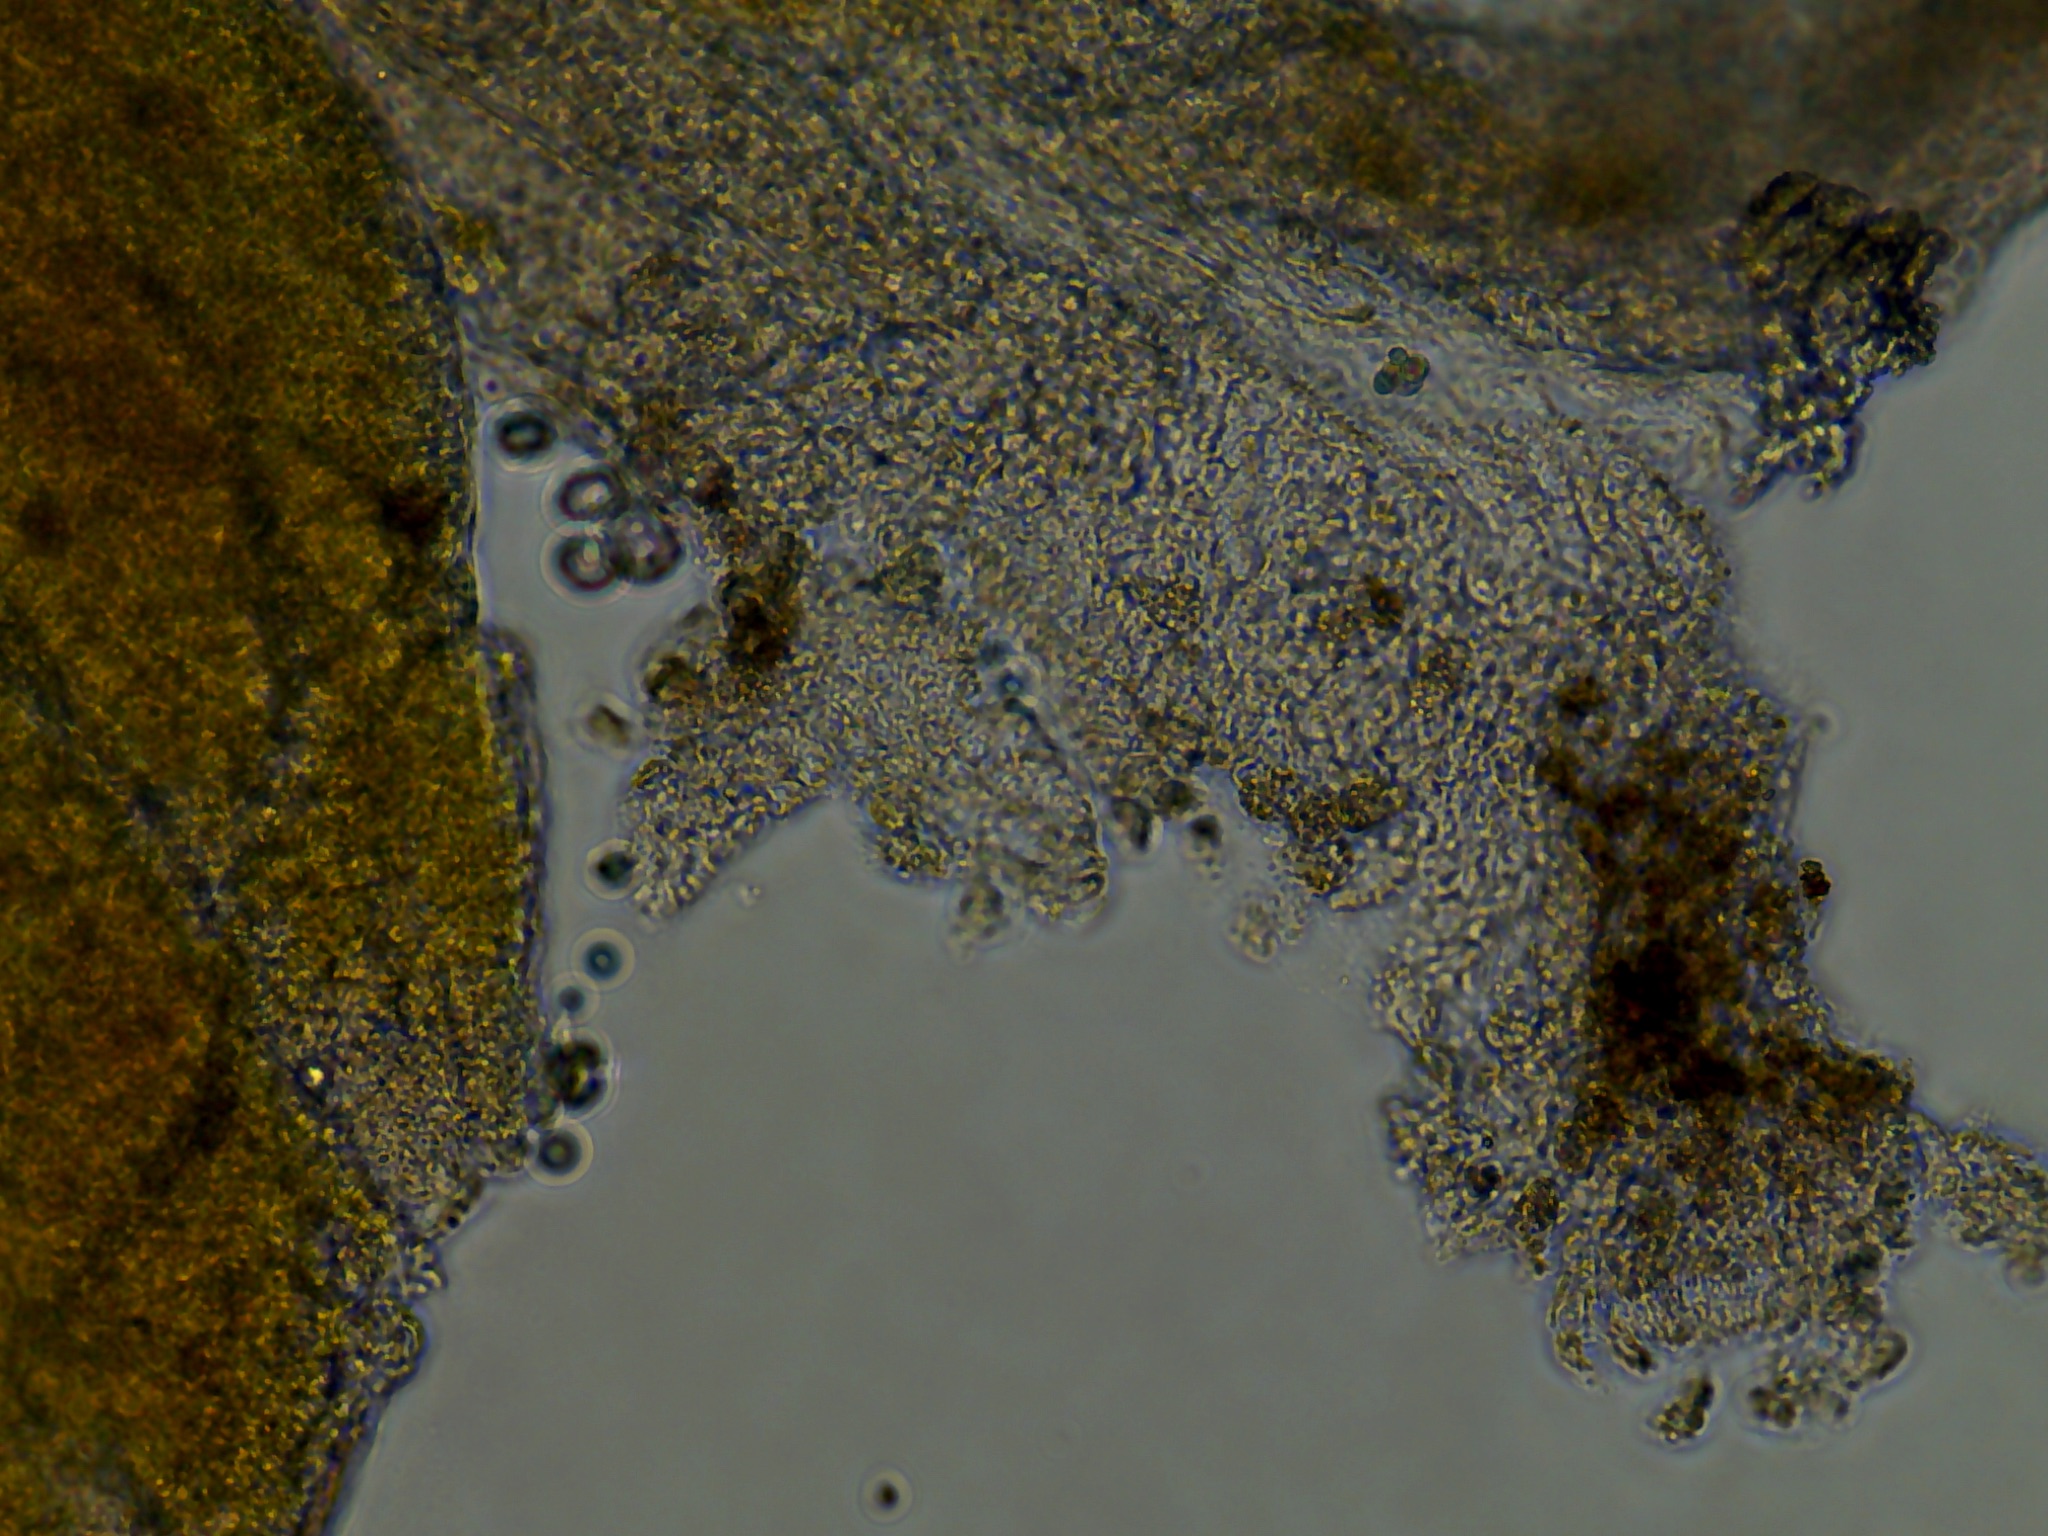
Cell morphology right after explanting tissue
In order to get a reference of the tissue prior to cell growth I took a few example images. Below we see that the tissue forms what appears to be a monolayer in the sense that the tissue is thin and somewhat transparent.
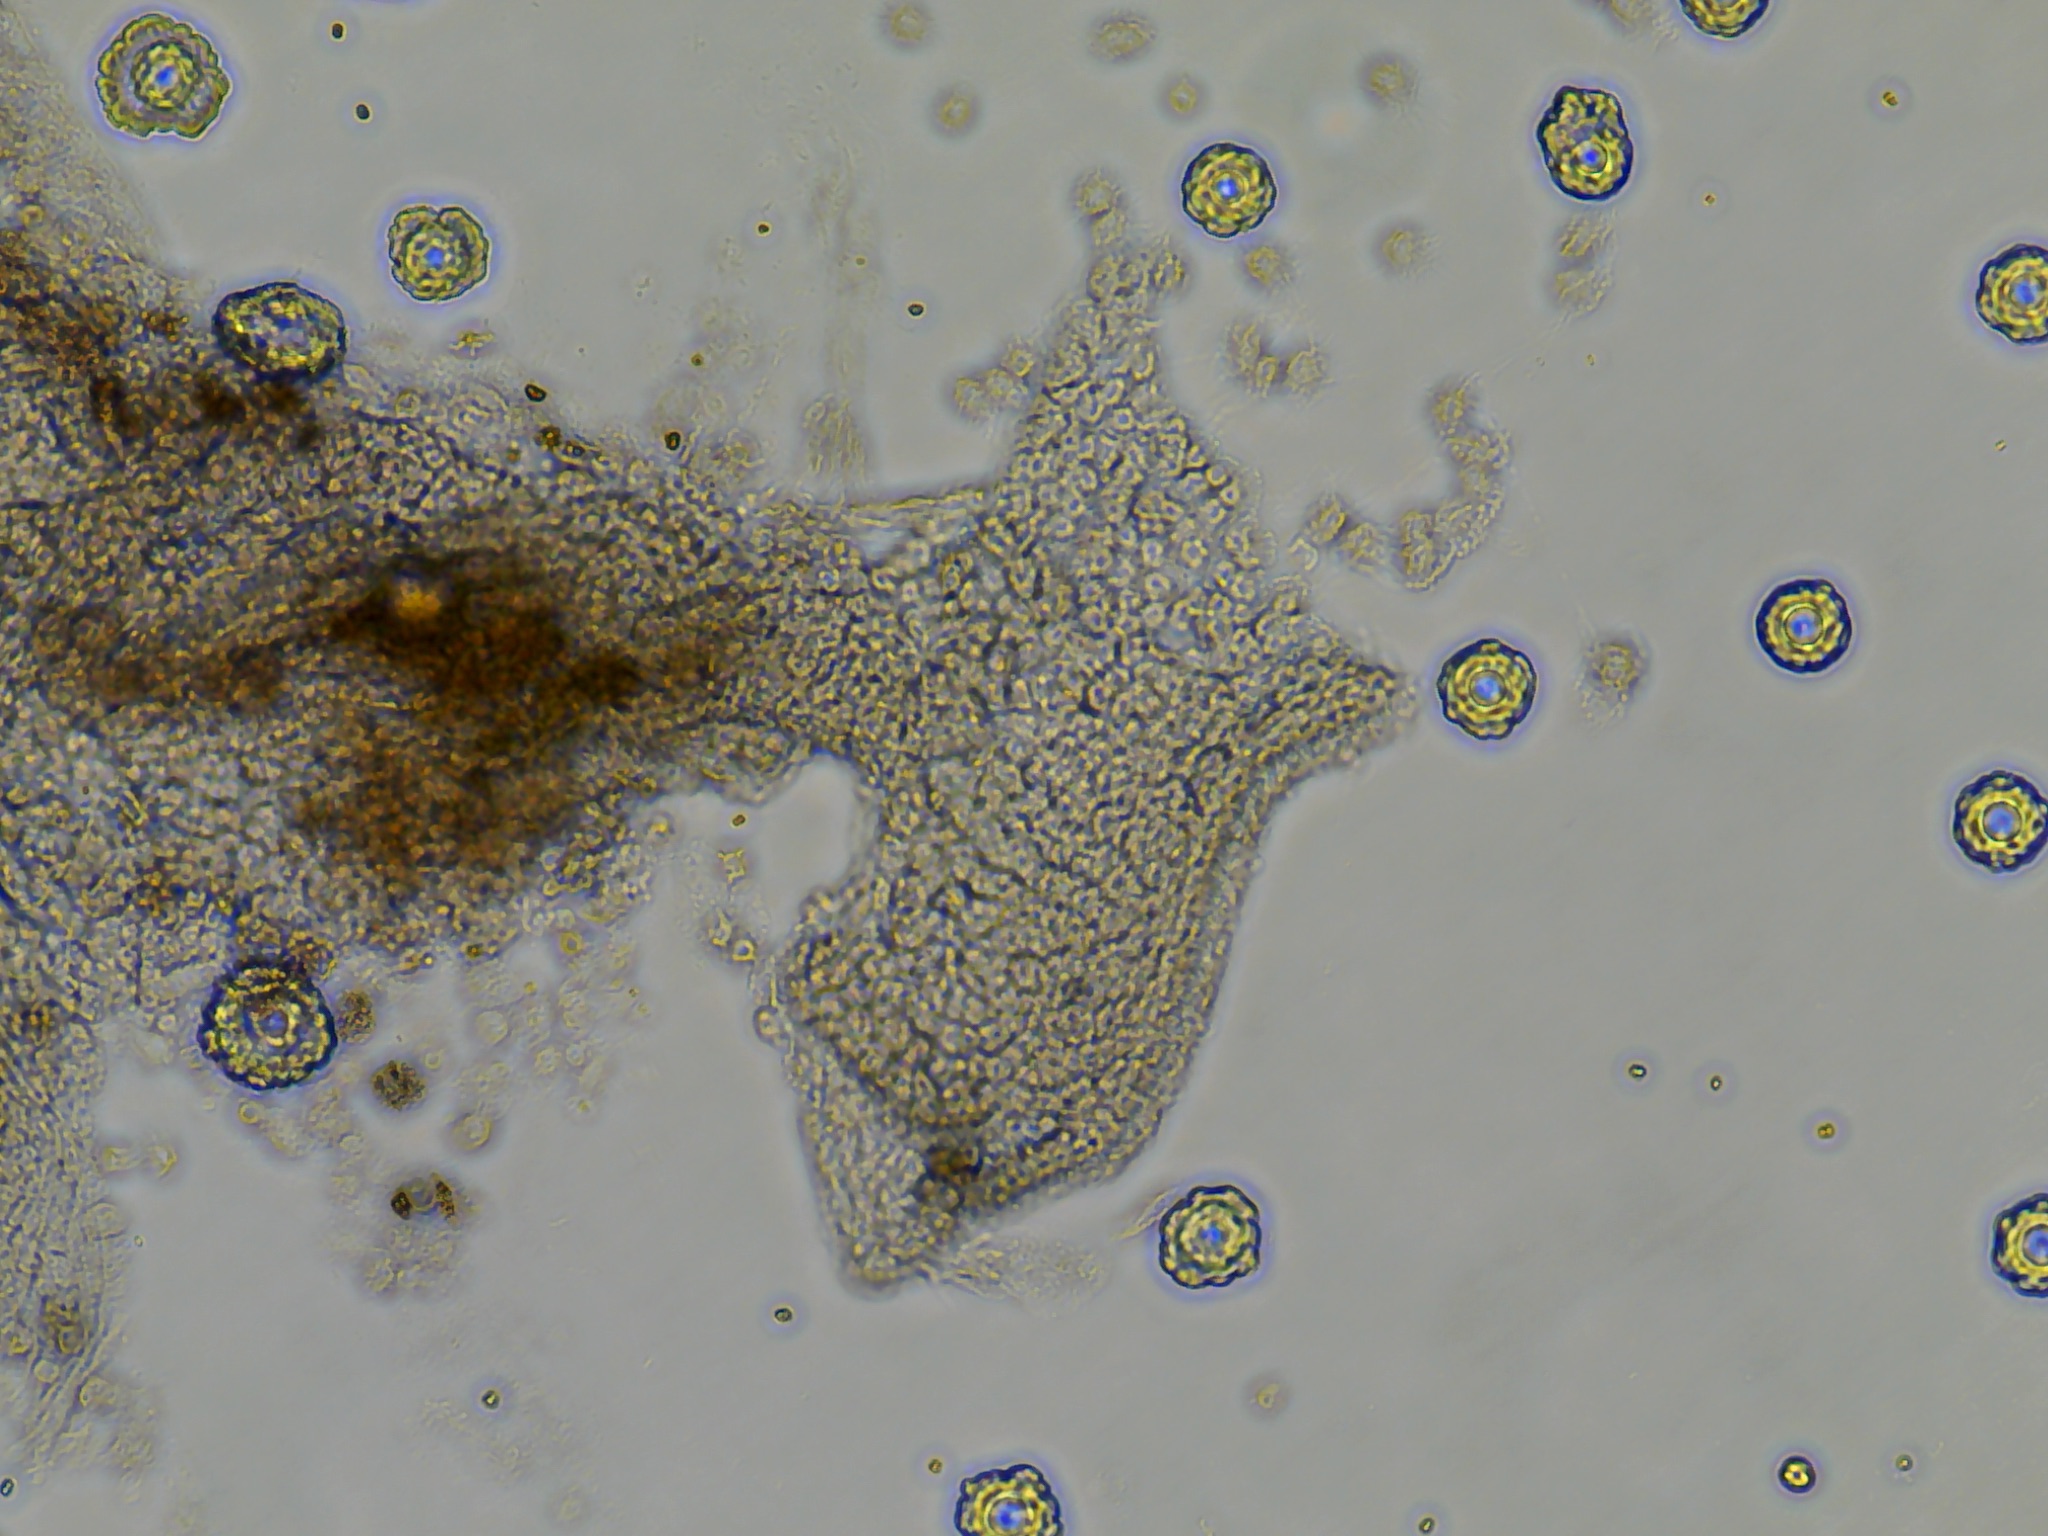
3 days post explant (dpe) monolayer growth and possible contamination
Three days after seeding the tissue, cell growth and contamination were qualitatively evaluated using the Evos XL Core inverted microscope.
Most notably:
- All wells from plate 1, with the lower dosage of antibiotics all had an unidentifiable but relatively dense distribution of spherical green clumps of cells. \
- Colony DM20230420_02 put out monolayer growth in several wells but most frequently in the last seeded well. I believe this was influenced by the differences in holding time in the ASW-PSA solution between removal from the tunic and seeding onto the plate. A reduced amount of time outside of a cellular context whether that be in vivo or in vitro influenced the ability for tissue pieces to put out monolayers.
As seen in the image the monolayer growth is distinct from the original tissue in its consistent cell shape, transperency, and dynamic appearance of ‘movement’ outwards.