Setting up packages and downloading data:
#requirements
library(tidyverse)
library(ggplot2)
library(viridis)
library(hrbrthemes)
#reading the data in manually
languages <- readr::read_csv('https://raw.githubusercontent.com/rfordatascience/tidytuesday/master/data/2023/2023-03-21/languages.csv')
Exploring the data set:
``` summary(languages)
##    pldb_id             title           description            type
##  Length:4303        Length:4303        Length:4303        Length:4303
##  Class :character   Class :character   Class :character   Class :character
##  Mode  :character   Mode  :character   Mode  :character   Mode  :character
##
##
##
##
##     appeared       creators           website          domain_name
##  Min.   :-2000   Length:4303        Length:4303        Length:4303
##  1st Qu.: 1984   Class :character   Class :character   Class :character
##  Median : 1997   Mode  :character   Mode  :character   Mode  :character
##  Mean   : 1991
##  3rd Qu.: 2012
##  Max.   : 2023
##
##  domain_name_registered  reference             isbndb          book_count
##  Min.   :1990           Length:4303        Min.   :  0.000   Min.   :  0.000
##  1st Qu.:2007           Class :character   1st Qu.:  0.000   1st Qu.:  0.000
##  Median :2013           Mode  :character   Median :  0.000   Median :  0.000
##  Mean   :2011                              Mean   :  7.706   Mean   :  2.079
##  3rd Qu.:2017                              3rd Qu.:  2.000   3rd Qu.:  0.000
##  Max.   :2023                              Max.   :400.000   Max.   :401.000
##  NA's   :3801                              NA's   :3217
##  semantic_scholar language_rank  github_repo        github_repo_stars
##  Min.   : 0.000   Min.   :   0   Length:4303        Min.   :    0
##  1st Qu.: 0.000   1st Qu.:1076   Class :character   1st Qu.:   29
##  Median : 0.000   Median :2151   Mode  :character   Median :  194
##  Mean   : 3.794   Mean   :2151                      Mean   : 2127
##  3rd Qu.: 3.000   3rd Qu.:3226                      3rd Qu.: 1071
##  Max.   :52.000   Max.   :4302                      Max.   :88526
##  NA's   :3545                                       NA's   :3414
##  github_repo_forks  github_repo_updated github_repo_subscribers
##  Min.   :    0.00   Min.   :2012        Min.   :   0.00
##  1st Qu.:    2.25   1st Qu.:2022        1st Qu.:   4.00
##  Median :   16.00   Median :2022        Median :  13.00
##  Mean   :  261.29   Mean   :2021        Mean   :  62.34
##  3rd Qu.:   91.50   3rd Qu.:2022        3rd Qu.:  44.00
##  Max.   :23732.00   Max.   :2023        Max.   :2910.00
##  NA's   :3417       NA's   :3418        NA's   :3418
##  github_repo_created github_repo_description github_repo_issues
##  Min.   :2006        Length:4303             Min.   :   0
##  1st Qu.:2013        Class :character        1st Qu.:   1
##  Median :2016        Mode  :character        Median :   9
##  Mean   :2016                                Mean   : 123
##  3rd Qu.:2019                                3rd Qu.:  61
##  Max.   :2022                                Max.   :9522
##  NA's   :3425                                NA's   :3518
##  github_repo_first_commit github_language    github_language_tm_scope
##  Min.   :1987             Length:4303        Length:4303
##  1st Qu.:2012             Class :character   Class :character
##  Median :2015             Mode  :character   Mode  :character
##  Mean   :2015
##  3rd Qu.:2018
##  Max.   :2022
##  NA's   :3567
##  github_language_type github_language_ace_mode github_language_file_extensions
##  Length:4303          Length:4303              Length:4303
##  Class :character     Class :character         Class :character
##  Mode  :character     Mode  :character         Mode  :character
##
##
##
##
##  github_language_repos  wikipedia         wikipedia_daily_page_views
##  Min.   :       0      Length:4303        Min.   :   -1.0
##  1st Qu.:      91      Class :character   1st Qu.:    9.0
##  Median :     726      Mode  :character   Median :   24.0
##  Mean   :  197135                         Mean   :  227.1
##  3rd Qu.:    7900                         3rd Qu.:   99.0
##  Max.   :16046489                         Max.   :13394.0
##  NA's   :3833                             NA's   :2837
##  wikipedia_backlinks_count wikipedia_summary  wikipedia_page_id
##  Min.   :    1.0           Length:4303        Min.   :     928
##  1st Qu.:   13.0           Class :character   1st Qu.:  375154
##  Median :   39.0           Mode  :character   Median : 2114700
##  Mean   :  318.6                              Mean   : 9167847
##  3rd Qu.:  126.0                              3rd Qu.:12321223
##  Max.   :34348.0                              Max.   :63063548
##  NA's   :2877                                 NA's   :2893
##  wikipedia_appeared wikipedia_created wikipedia_revision_count
##  Min.   :1830       Min.   :2001      Min.   :    1.0
##  1st Qu.:1980       1st Qu.:2003      1st Qu.:   35.0
##  Median :1994       Median :2005      Median :   84.0
##  Mean   :1991       Mean   :2006      Mean   :  330.4
##  3rd Qu.:2005       3rd Qu.:2007      3rd Qu.:  242.0
##  Max.   :2019       Max.   :2020      Max.   :10104.0
##  NA's   :2958       NA's   :3040      NA's   :3130
##  wikipedia_related  features_has_comments features_has_semantic_indentation
##  Length:4303        Mode :logical         Mode :logical
##  Class :character   FALSE:3               FALSE:516
##  Mode  :character   TRUE :617             TRUE :65
##                     NA's :3683            NA's :3722
##
##
##
##  features_has_line_comments line_comment_token last_activity  number_of_users
##  Mode :logical              Length:4303        Min.   :-900   Min.   :      0
##  FALSE:21                   Class :character   1st Qu.:1992   1st Qu.:      0
##  TRUE :517                  Mode  :character   Median :2006   Median :     20
##  NA's :3765                                    Mean   :2001   Mean   :  13771
##                                                3rd Qu.:2021   3rd Qu.:    230
##                                                Max.   :2023   Max.   :7179119
##
##  number_of_jobs     origin_community   central_package_repository_count
##  Min.   :     0.0   Length:4303        Min.   :0
##  1st Qu.:     0.0   Class :character   1st Qu.:0
##  Median :     0.0   Mode  :character   Median :0
##  Mean   :   422.2                      Mean   :0
##  3rd Qu.:     0.0                      3rd Qu.:0
##  Max.   :771996.0                      Max.   :0
##                                        NA's   :1482
##   file_type         is_open_source
##  Length:4303        Mode :logical
##  Class :character   FALSE:58
##  Mode  :character   TRUE :453
##                     NA's :3792
##
##
##
It looks like there are a lot of NA’s in most of the columns. But I am not worried about removing them since there are none in the data I want to extract.
Objective
After a quick skim of the data, I have decided that I am interested in the correlation of material availability to the number of users over time.
Questions
- Are the most popular languages the ones with the most documentation out there?
- Has the methods for documenting programming languages changed over time?
Creating exploratory plots with base R:
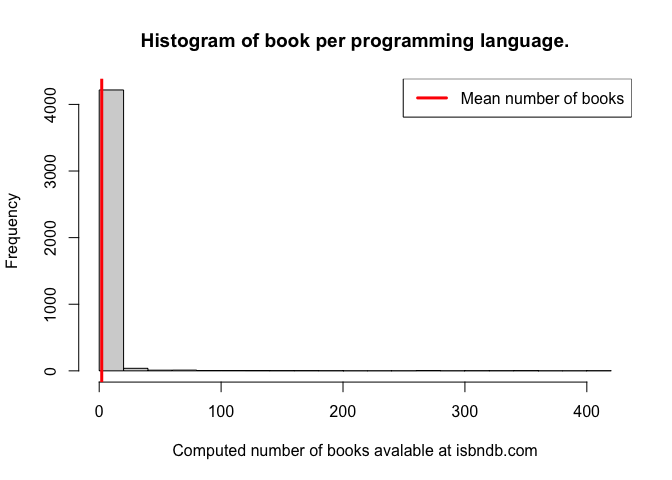
hist(languages$book_count,
     breaks = 20,
     xlab = "Computed number of books avalable at isbndb.com",
     main = "Histogram of book per programming language." )
abline(v = mean(languages$book_count), col='red', lwd = 3)
legend("topright", legend = "Mean number of books", col = 'red', lwd = 3)
hist(languages$number_of_users,
     breaks = 20,
     xlab = "Number of users",
     main = "Histogram of the number of users per programming language." )
abline(v = mean(languages$number_of_users), col='blue', lwd = 3)
legend("topright", legend = "Mean number of users", col = 'blue', lwd = 3)

Based off of these exploratory plots, it’s clear that we need to do some transformation on the continuous data since it’s so skewed. I figured I should create new columns for the number of users and book count using lognormal transformations.
Transforming and manipulating data:
languages2 <-
  languages %>%
  mutate(log_users = log(number_of_users + 1)) %>% #lognormal transformation
  filter(log_users > 0) %>% #removing programming languages with no users
  mutate(log_books = log(book_count + 1)) %>% #lognormal transformation
  mutate(website2 = ifelse(website == github_repo, yes = NA, no = website))  %>% #making a new website column where github_repo isn't repeated
  mutate(dupes = website == github_repo) %>% #making a column to quickly navigate to the rows that have duplicate entries
  mutate(score = as.factor(as.integer(!is.na(website2)) + as.integer(!is.na(github_repo)))) %>% #creating a score column that adds up whether the programming language has online resources such as a website or GitHub repo. I decided not to include Wikipedia pages in this score since it is not likely to have much information regarding how to use the language.
  filter(appeared >= 1957) %>% #removing any programming languages from before 1957 since a quick Google search says that computer programming as coding came about in the late 1950s with the invention of FORTRAN, LISP and COBOL.
  select(title, appeared, log_users, log_books, website2, github_repo, score, dupes, book_count) %>%
  arrange(desc(log_users))

head(languages2)

## # A tibble: 6 × 9
##   title appeared log_users log_books website2 github_repo score dupes book_count
##   <chr>    <dbl>     <dbl>     <dbl> <chr>    <chr>       <fct> <lgl>      <dbl>
## 1 SQL       1974      15.8      5.21 <NA>     <NA>        0     NA           182
## 2 Java…     1995      15.6      5.86 <NA>     <NA>        0     NA           351
## 3 HTML      1991      15.5      4.76 <NA>     <NA>        0     NA           116
## 4 Java      1995      15.5      6.00 <NA>     <NA>        0     NA           401
## 5 C++       1985      15.2      4.86 <NA>     <NA>        0     NA           128
## 6 C         1972      15.1      4.37 <NA>     <NA>        0     NA            78
I added in a few columns that help me evaluate the metrics I want to use. I noticed that there were duplicate entries for 48 rows where the website and GitHub repo values were the same thing. I want to get rid of the website entries for those that have duplicate values and set them to NA.
I also removed programming languages from the data set that didn’t have any users. Most of those also had NAs in the columns I wanted to use.
Creating plot
ggplot(languages2, aes(x = appeared, y = log_users, color = score, size = log_books)) +
  geom_point(alpha=0.5) +
  scale_size(range = c(1, 12), name="Log Book Count") +
  scale_color_viridis(discrete = TRUE , option = "C")+
  theme(legend.position="right") +
  xlab("Year Programming Language Appeared")+
  theme_ipsum()+
  ylab("Log Number of Users")

ggplot(languages2, aes(x = appeared, y = log_users, color = score, size = book_count)) +
  geom_point(alpha=0.5) +
  scale_size(range = c(1, 12), name="Book Count") +
  scale_color_viridis(discrete = TRUE , option = "C")+
  theme(legend.position="right") +
  xlab("Year Programming Language Appeared")+
  theme_ipsum()+
  ylab("Log Number of Users")

Based off trends in the plot, it seems like the most popular newer (appearing after the year 2000) languages are likely to have a website and GitHub repo in addition to having several books on the language. The most popular languages however have for sure the most number of books (in the 400s).
I decided to make two plots with the size of the bubble being dependent on either the log(book_count) calculation or the raw count. I feel like it is more obvious that the most popular languages have more books based on the latter. However, that data is obviously very skewed so I’m curious to know what is best practice. Maybe, my initial thoughts of lognormal transformation of the data doesn’t necessarily mean that I will be better able to communicate it.